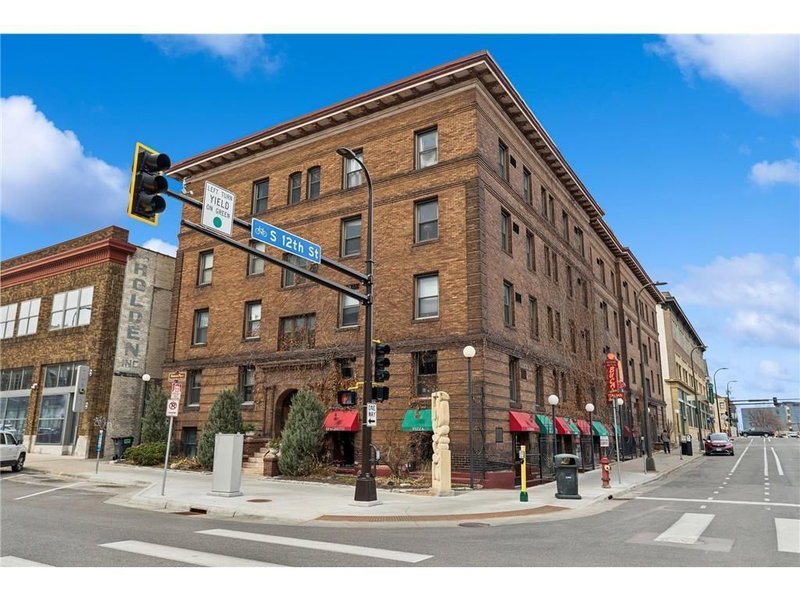
433 S 7th Street #2126, Minneapolis, MN 55415 - MLS# 7113934
$97,500
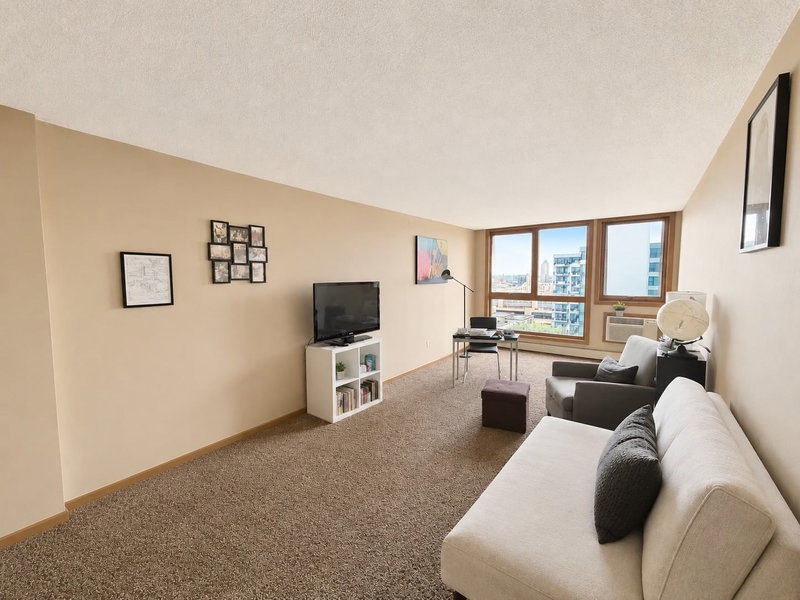
Downtown living with amazing skyline views and secured skyway access. Walk to all the bars, restaurants, and venues downtown has to offer, including US Bank Stadium. This pet-friendly unit features a bar countertop that opens up the flow between the kitchen and living room, adding a great sense of space and flexibility. Major features updated between 2022 and 2026 including flooring, lighting, refreshed bathroom, new AC, kitchen cabinets, stainless steel appliances, and refreshed paint. Residents enjoy access to the building's beautifully updated amenities, including a rooftop pool and deck, sauna, exercise room, and even more community spaces.
Interior Information
Size & Levels
Bathrooms
Rooms
Main Level Rooms
Exterior & Parking
Lot & Utilities
Homeowners Association
Financial & Tax Information
Location
Neighborhood at a Glance
In this neighborhood, homes were most commonly built in 1980-1989, about 14% of occupied homes are owner-occupied, and the average commute is 19 minutes.
Cost of Ownership
Median property taxes paid
$2,417/yr
Lower than the Minneapolis median
The midpoint of annual property taxes paid by homeowners.
Typical monthly owner costs (with mortgage)
$2,201/mo
Similar to the Minneapolis median
Median monthly housing costs for owners with a mortgage.
Median rent
$1,453/mo
Higher than the Minneapolis median
The midpoint of monthly gross rent, including utilities.
Homes in the Area
Owner-occupied homes
14%
Lower than Minneapolis overall
The share of occupied homes lived in by their owners.
Median year built
1988
Similar to the Minneapolis median
The midpoint of years when homes in the area were built.
Home age by decade
The share of homes built during each period.
- 2010-20197%
- 2000-200921%
- 1990-199916%
- 1980-198935%
- 1939 or earlier9%
Types of homes
The share of housing units in each building type.
- 5+ units96%
Getting Around
Average commute
19 min
Lower than the Minneapolis median
The average one-way travel time to work for commuters.
How people get to work
The share of workers using each listed way to get to work.
- Drive alone30%
- Public transit12%
- Walk or bike31%
- Work from home25%
Homes with broadband
89%
Similar than Minneapolis overall
The share of households with a broadband internet subscription.